Creating a Fishbone Diagram
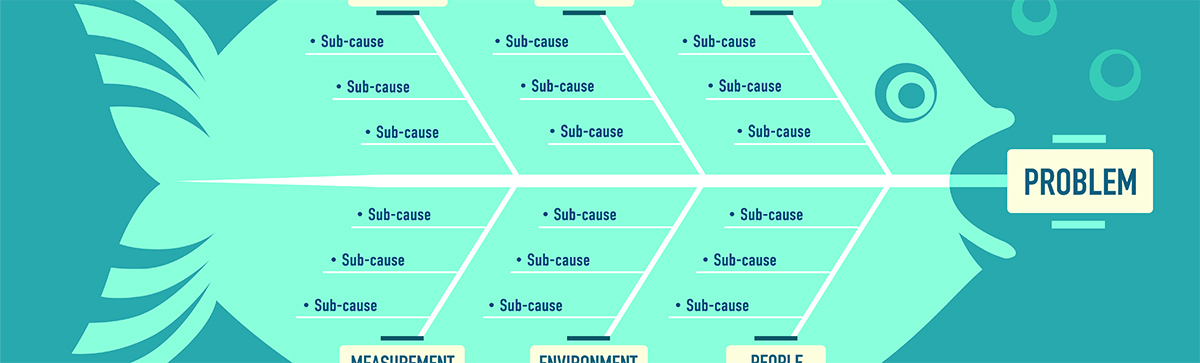
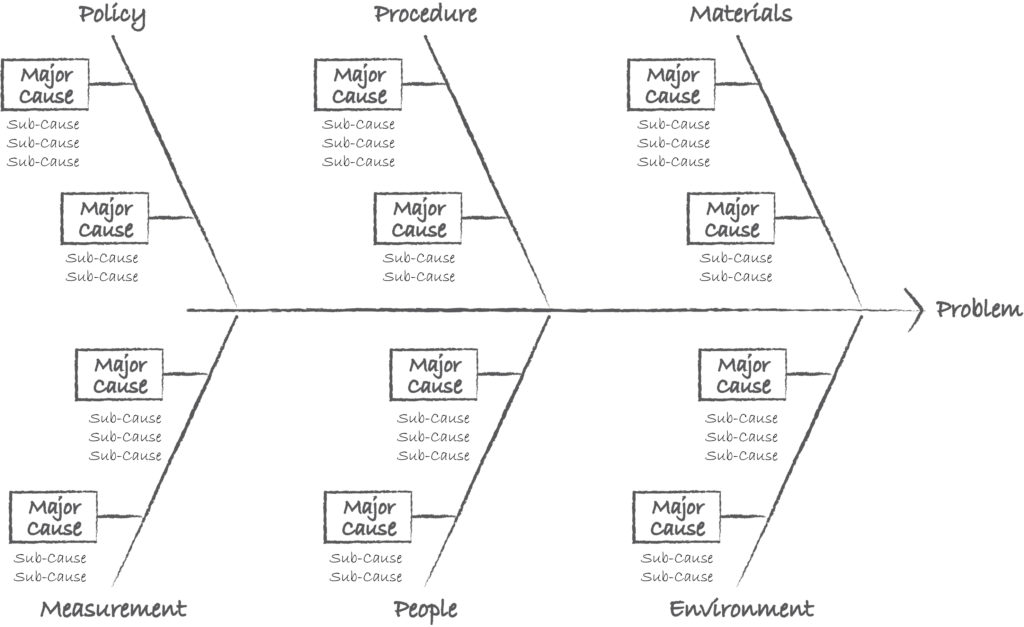
A fishbone diagram is used to graphically display potential causes of a problem. The layout shows relationships between potential causes and is used in the analysis phase of event investigation.
Instructions:
- Place the problem or outcome statement on the right side of the paper, half-way down; draw a horizontal line across the paper with an arrow pointing to the effect or problem statement.
- Categorize the causes and connect them to the horizontal line with the diagonal lines. Use at least five categories of every process. Typical categories include:
- Policies (high level decision rules)
- Procedures (specific tasks)
- Materials
- Measurement
- People
- Environment
- Note the major causes and place them under the general categories. Use brainstorming techniques as needed for the different categories.
- List sub-causes under the main cause if appropriate. To determine sub-causes, ask “why?” five times. Focus on “drilling down” during the 5-why question review versus becoming broader. For example: WHY did the resident fall? Because she was weak? WHY is she weak? Due to deconditioning? WHY did she become deconditioned? Because she has pain and unstable blood pressure making her dizzy. WHY does she have pain/WHY can’t it be treated? WHY is her blood pressure unstable?
- Evaluate the diagram. Are the branches on the cause and effect diagram labeled and arranged in a logical sequence?
A few tips:
- Use a narrowly defined problem or outcome as a starting point
- Causes should be verified with data to confirm that they are actual causes not coincidence
- Do not use the diagram as an alternative form of outlining facts and information
- This tool should not be used to list potential solutions